In this page
In short
- A count compares what you counted with what should be there: opening stock, plus what you received, less what sales used and the waste logged.
- Count in the unit you buy in, at the same time each time, and do not show the person counting the expected figure.
- Multiply each gap by the unit cost before VAT to see it in riyals, and start with the costliest items.
What a count is, and when to do one
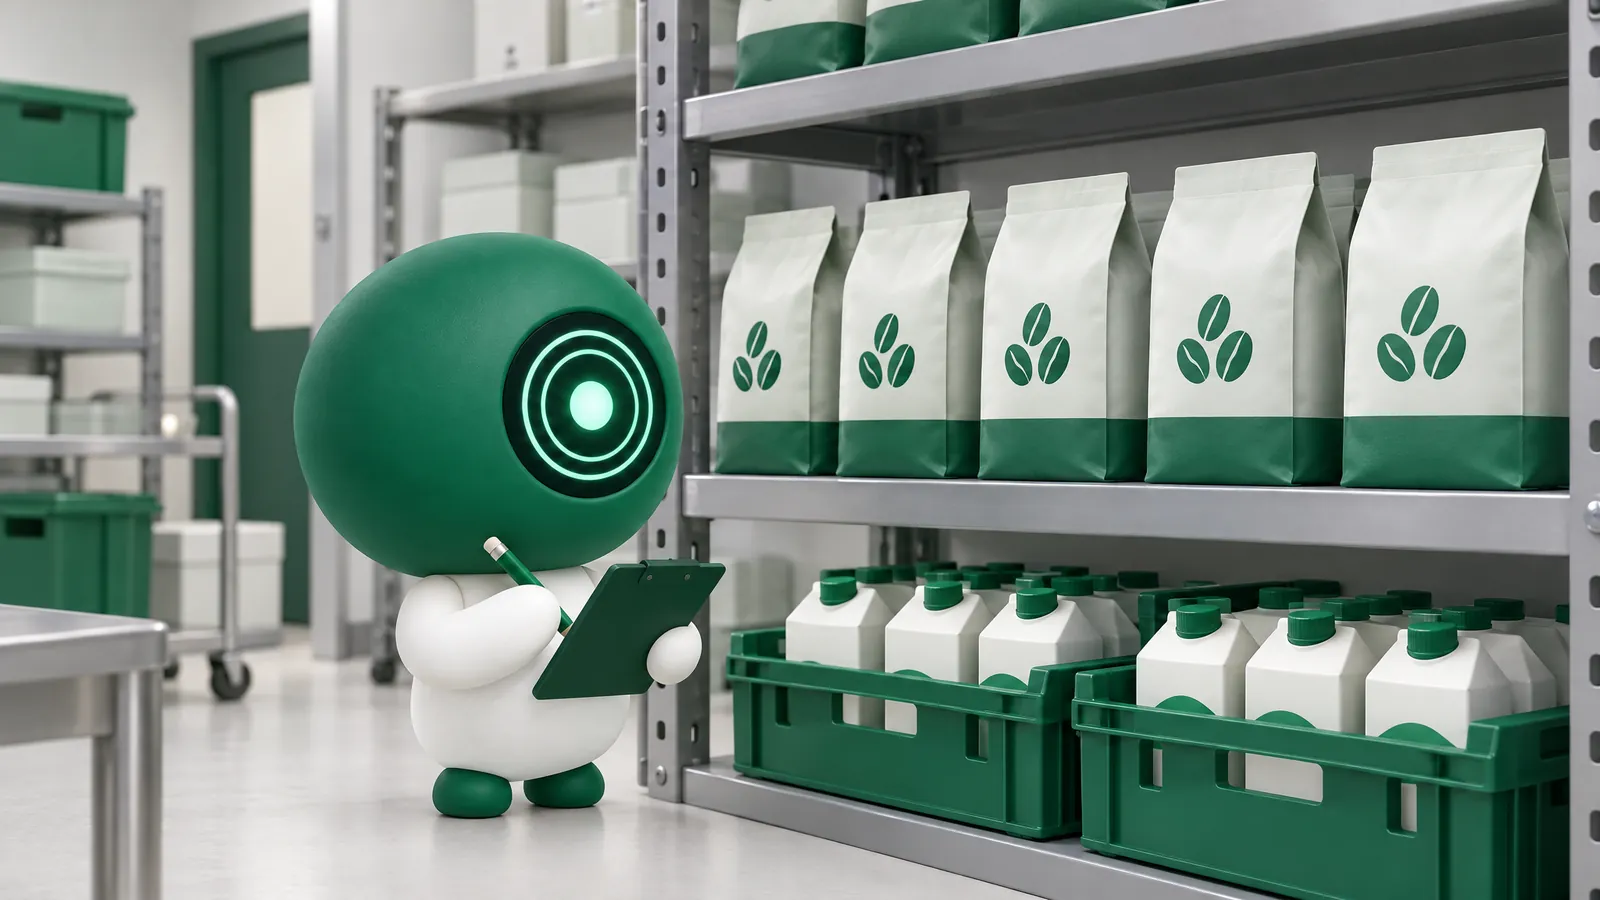
A stock count is counting what is really on the shelves and in the fridges, then comparing it with what should be there. You count ingredients and packaging, not finished items: beans, milk, syrups, meat, bread, cups and lids.
- A short count every day or every week of the costly, fast-moving items, such as beans, milk and meat.
- A full count of everything every month.
- A full count on the last day of your financial year.
These are suggestions, not a rule. What matters is counting at the same time each time, so one week compares with the next.
The count sheet to download
The sheet comes as two files: a count sheet the person counting prints, with no expected figure on it, and a file you enter the figures into after the count, which works out the expected figure, the gap and its value for you.
Stock count sheet
An Excel file with a blank sheet for fifty ingredients and a sheet with this article’s worked example, and a count sheet in PDF to print.
- Item, unit and place: the fridge, the store or the bar.
- Opening stock and received from suppliers: from your last count and your invoices.
- Used by sales and waste logged: what left with sales and what was thrown away.
- Counted and unit cost before VAT: what you found, and its price on the supplier’s invoice.
How to count
- Pick a time when nothing moves: before opening or after closing.
- Put the sheet in shelf order, and count place by place.
- Count in the unit you buy in: kilos, litres, pieces.
- Write an opened pack as a fraction: half a 1 kg bag of beans is 0.5.
- The person counting writes what they see, and does not see the expected figure, so they cannot copy it.
- Count anything far from usual a second time.
Worked example: a week in a coffee shop
This week the shop sold 500 lattes made as in the article on the cost of a cup of coffee: 18 g of beans, 220 ml of milk, and a cup and lid. The prices are made up, so put your own invoice prices before VAT in their place.
| Item | Opening | Received | Used | Waste | Expected | Counted | Short | Unit cost | Value short |
|---|---|---|---|---|---|---|---|---|---|
| Milk (litres) | 30 | 100 | 110 | 2 | 18 | 14 | 4 | SAR 7.00 | SAR 28.00 |
| Beans (kilos) | 3 | 10 | 9 | 0.2 | 3.8 | 3.2 | 0.6 | SAR 120.00 | SAR 72.00 |
| Cup and lid (sets) | 300 | 500 | 500 | 10 | 290 | 270 | 20 | SAR 0.50 | SAR 10.00 |
| Total | SAR 110.00 | ||||||||
Take the milk: 30 litres were on the shelf, you received 100, sales used 110 and 2 were logged as waste, so 18 litres were expected. 14 were counted, so 4 litres are short, worth 4 × 7 = SAR 28.
The week is SAR 110 short, and if every week were the same that would be SAR 440 over four weeks. For a sense of scale: 4 litres of milk make 18 lattes, and 600 g of beans make 33 cups.
How to read the gap
Do not start by suspecting anyone. Check the causes in this order:
- A supplier invoice received but not recorded.
- A wrong quantity when the goods came in.
- Waste thrown away and not logged.
- Portions bigger than the recipe, or a wrong recipe.
- Only then, loss.
A gap that grows week after week has a cause. Check a surplus the way you check a shortage: usually a refund not recorded, a recipe bigger than what is really made, or a mistake when the goods came in. We give no “acceptable” percentage for the gap, because there is no dated, reliable source for one.

The year-end count
On the last day of your financial year, count everything in every place and value it as quantity × unit cost before VAT. In our example: 3.2 kilos of beans × 120 = SAR 384, 14 litres of milk × 7 = SAR 98, and 270 sets of cups and lids × 0.50 = SAR 135, for SAR 617 in all.
How dots POS counts
In dots POS you do not work out the “Used by sales” column by hand:
- Each item and each extra has a recipe whose ingredients come off the branch’s stock with every sale and every accepted online order, and go back on a refund.
- Your staff count ingredient by ingredient in the dots Teams app without seeing the expected figure, and a figure far from it is counted again. Each ingredient has a count schedule.
- Waste is logged from the phone with a photo and a reason, comes off stock, and shows who logged it and when.
- After a count, stock is set to what was counted, and the Usage check report compares what was used with what the recipes say.
- Each ingredient costs the average of its supplier invoice prices before VAT, worked out again with every invoice you receive. Sales, counts and waste never change it.
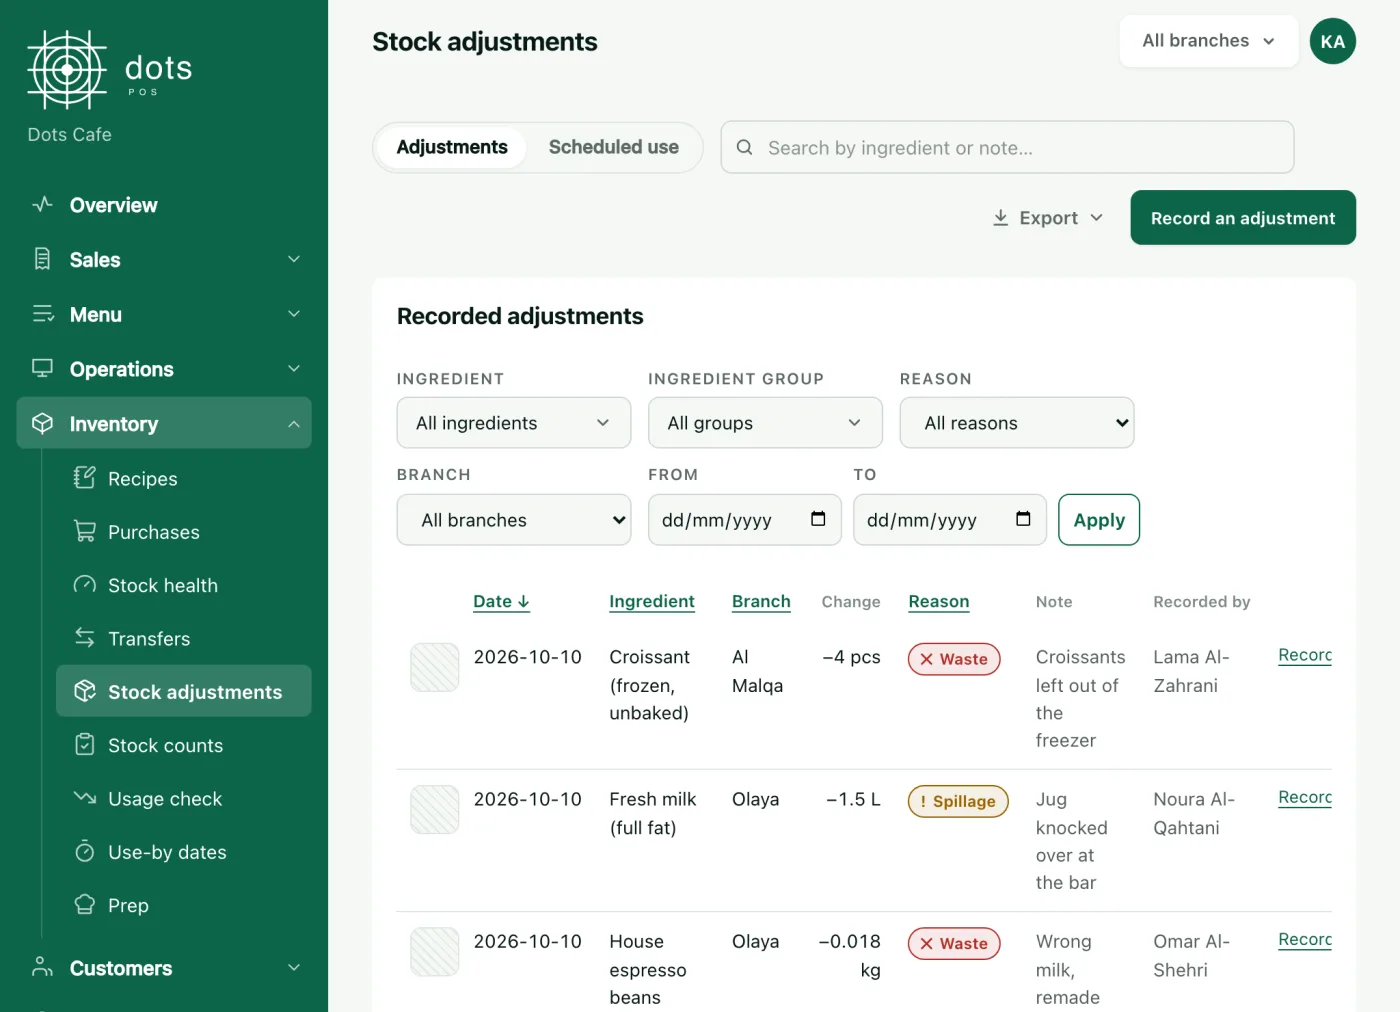
Stock, recipes and counts are in the POS+ plan: SAR 199 a month for the first branch, VAT included, each further branch at half price, and SAR 1,910 a year for one branch paid yearly. Reading a supplier invoice from a photo is in POS Advanced.
Questions
How often should I count my stock?
The costly, fast-moving items every week or more often, and everything at least once a month. This is a suggestion; what matters is keeping to one schedule.
Do I count finished items or ingredients?
Ingredients and packaging. A finished item has no stock of its own unless it is made ahead in batches.
I found a surplus, not a shortage. What does it mean?
Usually a refund not recorded, a recipe bigger than what is really made, or a mistake when the goods came in.
Does dots POS stop selling when an ingredient runs out?
No. Sales do not stop, and the shortfall shows in stock until a count or an invoice puts it right.
Source: The Recipes, Stock counts, Stock adjustments and Usage check screens in the dots dashboard, and the dots Teams app for counts and waste.